Support / The map & data / Reading your map

Reading your map: coverage and the 20 data layers

Your map is the proof of what the robot actually did, and where it struggled. Yardstick records every position the robot logs, then draws it as a coverage grid over a photo of your yard. The colors are the story. This page shows you how to read them.

Where it lives: http://<computer-ip>:8477/ The main page. Open it in Chrome or Edge on your network and the map is right there.
The short version The map has three parts: summary tiles across the top, a row of layer buttons under them, and the aerial coverage map itself. The tiles score the whole run. The buttons repaint the map by one measurement at a time. The map shows where the robot actually went. That is the entire tool.
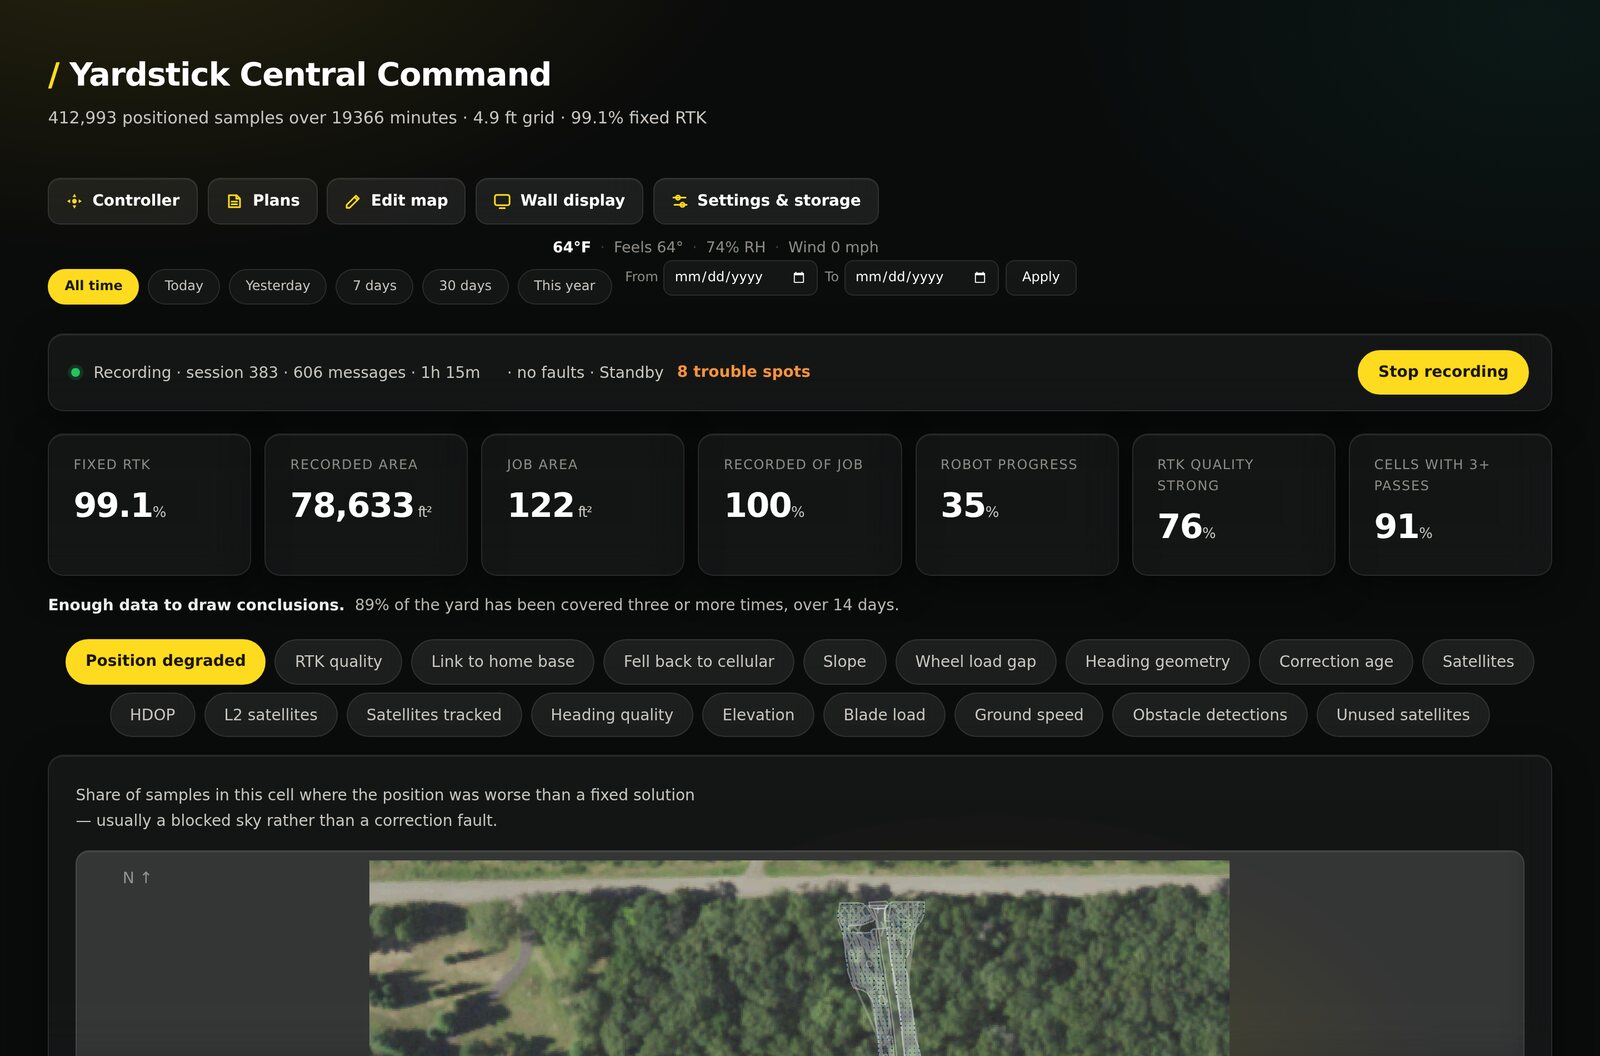
The Yardstick dashboard: a row of summary tiles across the top, a row of layer buttons below them, and an aerial coverage map of the yard filling the rest of the page.
The main page. Summary tiles up top, layer buttons in the middle, and the coverage map painted over an aerial photo of your property.

The summary tiles

The tiles across the top score the whole run in a glance, before you touch a single layer. They tell you how much of the yard got covered, how well the robot's GPS held up, and whether there is enough data to trust the picture.

Fixed RTK %
The share of samples that had a fixed, centimeter-level GPS solution. Higher means the robot knew exactly where it was for more of the run.
Recorded area
How much ground the robot actually recorded covering.
Job area
The size of the area the job was meant to cover.
Recorded of job %
Recorded area as a share of the job area. How much of the plan got done.
Robot progress %
The robot's own reported progress through the job.
RTK quality strong %
The share of the run where the robot's own confidence in its GPS was strong.
Cells with 3+ passes %
How much of the yard the robot covered three or more times.
The readiness line Near the tiles you will see a short line such as "Enough data to draw conclusions." It is a plain check on whether the run recorded enough to trust what the map is telling you. If it says otherwise, let the robot record more before reading too much into a single layer.

How to read the colors

Under the tiles is a row of layer buttons. Pick one and the coverage grid repaints to color every cell by that one measurement. There are three ways a layer can be colored, and knowing which one you are looking at is most of the skill.

BLUE RAMP

Magnitude

A layer that has more or less of something. The good end recedes into the surface. Where color builds up is where to look.

RED ALERT

Events

A red palette that marks only where something happened. It is drawn only where it matters, so any red is worth a look.

NEUTRAL

No good or bad end

A layer that just maps a fact, like slope or elevation. Color shows the shape of the thing, not a problem.

The coverage grid underneath it all Whatever layer you pick, the grid itself shows where the robot actually went. Cells with more passes are more covered. That is why the Cells with 3+ passes tile matters: it is the difference between a spot the robot brushed once and a spot it truly finished.

The 20 layers

Each button below is one layer. The tag on each one tells you which direction is trouble: whether a high reading is the warning sign, a low reading is, or the layer just maps a fact with no good or bad end. Some layers are drawn only where the thing happened.

Positioning & RTK

Position degraded (%)HIGH = WORSE
The share of samples worse than a fixed solution. Usually a blocked sky rather than a base-station fault.
RTK quality (0 to 1)LOW = WORSE
The robot's own confidence score. It tracks the dual-antenna heading, not position, so it can read low while position is still centimeter-accurate.
Correction age (s)HIGH = WORSE
How old the RTK correction stream is. High means corrections are arriving late, a network problem.
Heading geometry (m)HIGH = WORSE
How far the measured antenna spacing drifts from the true spacing. A sign of a wrong heading solution.
Heading quality (m)HIGH = WORSE
Departure of the computed antenna distance from the true value. Carrier-phase errors.

Satellites

SatellitesLOW = WORSE
How many satellites were used in the solution.
Satellites trackedLOW = WORSE
How many were seen before any were rejected. Compare with used to spot reflections.
L2 satellitesLOW = WORSE
Dual-frequency satellites. Fewer makes RTK more fragile.
Unused satellitesHIGH = WORSE
Tracked but rejected. Collapsing toward zero warns of a dropout.
HDOPHIGH = WORSE
Horizontal dilution of precision, a measure of satellite geometry. Lower is better.

Radio & link

Link to home base (dBm)LOW = WORSE
HaLow radio signal from the robot to its base. Less negative is better. Around -75 dBm is where it gives way. This is a radio map, not a navigation one.
Fell back to cellular (%)ONLY WHERE IT HAPPENS
How often the robot dropped the home-base radio and used the mobile network. The layer to act on.

Terrain

Slope (degrees)NEUTRAL
The tilt of the ground.
ElevationNEUTRAL
Height of the ground. Maps the lay of the land.

Cutting & motion

Blade load (A)NEUTRAL
Cutting-motor current, effectively how thick the grass is.
Ground speed (m/s)NEUTRAL
How fast the robot was moving. Slow patches mean turns, thick grass, or slope.
Wheel load gap (A)HIGH = WORSE
The current difference between the two drive wheels. A gap signals a rut, curb, or drag.
Blade RPM (rpm)NEUTRAL
How fast the cutting blades were spinning. It holds fairly steady while cutting and dips under a heavy load, so it pairs with blade load.
Machine temperature (°)NEUTRAL
The robot's own onboard ambient sensor, shown in your Fahrenheit or Celsius choice. Warm spots are usually sun and time of day rather than a fault.
Safety

Obstacle detections (%)ONLY WHERE IT HAPPENS
Where sensors repeatedly detected something across passes.

Putting it to use

You do not need to read all eighteen. Most people start with two or three and only reach for the rest when something looks off.

A layer reading low is not always a fault RTK quality is the classic case. It scores the robot's heading confidence, not its position, so it can read low in a spot where the robot still knew exactly where it was. Cross-check with Position degraded before you worry.

Seeing a color you cannot explain? Open a support ticket and tell us which layer you had on and where the color showed up. Because Yardstick runs on your own machine, the full record is right there to look at.

Related

Yardstick is an independent tool for Yarbo robots. Not affiliated with or endorsed by Yarbo Inc. · © 2026 Yardstick Technologies LLC.